# File Name: app.R
# Simple Palmer Penguins Shiny App
# Set Up ----------------------------------------------------------------------
# Install packages if needed:
# install.packages(c("shiny", "palmerpenguins", "dplyr", "ggplot2"))
library(shiny)
library(palmerpenguins)
library(dplyr)
library(ggplot2)
# Data ------------------------------------------------------------------------
penguins <- palmerpenguins::penguins %>%
mutate(
species = as.factor(species),
island = as.factor(island)
)
# User interface --------------------------------------------------------------
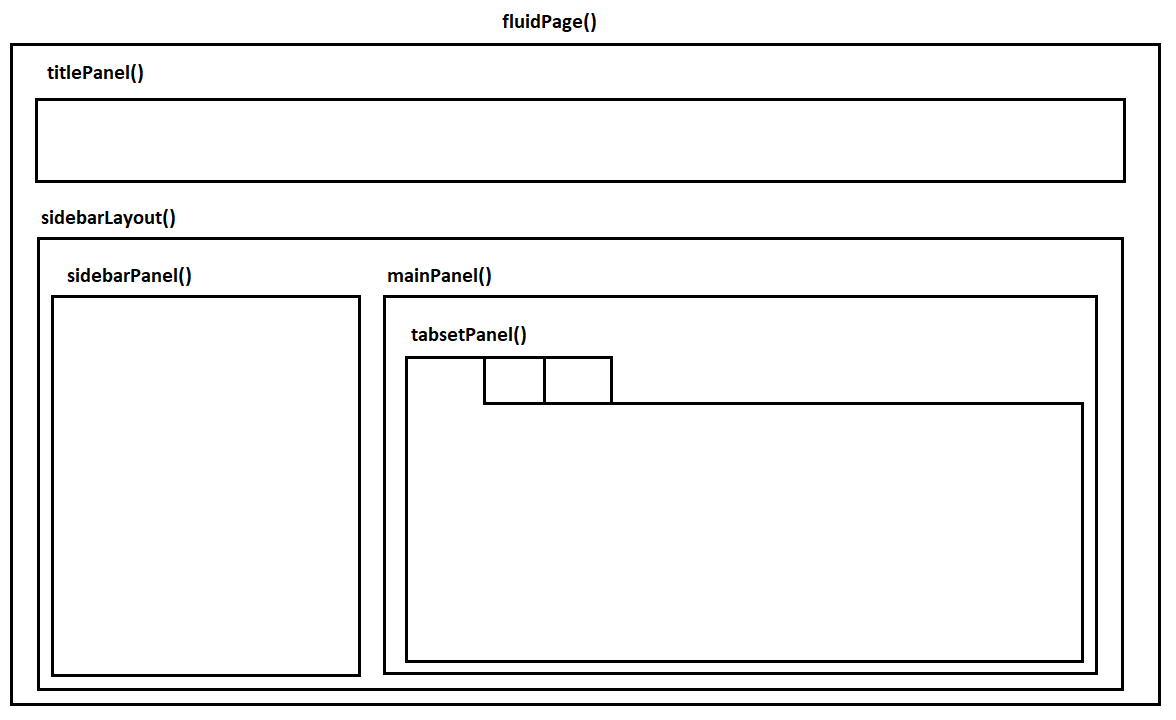
ui <- fluidPage(
titlePanel("Palmer Penguins Shiny Demo"),
sidebarLayout(
sidebarPanel(
selectInput(
inputId = "species",
label = "Choose species",
choices = c("All", levels(penguins$species)),
selected = "All"
),
selectInput(
inputId = "island",
label = "Choose island",
choices = c("All", levels(penguins$island)),
selected = "All"
),
checkboxInput(
inputId = "show_smooth",
label = "Show trend line",
value = TRUE
)
),
mainPanel(
h3("Summary"),
verbatimTextOutput("summary_text"),
h3("Scatterplot"),
plotOutput("penguin_plot", height = "450px")
)
)
)
# Server ----------------------------------------------------------------------
server <- function(input, output) {
output$summary_text <- renderPrint({
data <- penguins
if (input$species != "All") {
data <- data %>%
filter(species == input$species)
}
if (input$island != "All") {
data <- data %>%
filter(island == input$island)
}
cat("Rows:", nrow(data), "\n")
cat("Species:", paste(unique(data$species), collapse = ", "), "\n")
cat("Islands:", paste(unique(data$island), collapse = ", "), "\n")
cat("Average body mass:", round(mean(data$body_mass_g,
na.rm = TRUE), 1), "g\n")
})
output$penguin_plot <- renderPlot({
data <- penguins
if (input$species != "All") {
data <- data %>%
filter(species == input$species)
}
if (input$island != "All") {
data <- data %>%
filter(island == input$island)
}
data <- data %>%
filter(
!is.na(flipper_length_mm),
!is.na(body_mass_g)
)
p <- ggplot(
data,
aes(
x = flipper_length_mm,
y = body_mass_g,
colour = species
)
) +
geom_point(size = 3, alpha = 0.8) +
labs(
x = "Flipper length, mm",
y = "Body mass, g",
colour = "Species",
title = "Body mass and flipper length"
) +
theme_minimal(base_size = 14)
if (input$show_smooth) {
p <- p + geom_smooth(method = "lm", se = FALSE)
}
p
})
}
# Run app ---------------------------------------------------------------------
shinyApp(ui = ui, server = server)Reactive Shiny Apps and Google Cloud Run
Workshops for Ukraine
Alfredo Hernandez Sanchez
Vilnius University
2026-05-21
What is R Shiny?
A
Shinyapp is a web app connected to a computer running an R session.The front facing elements are in the User Interface (UI) and the back code is in the Server.
Users can manipulate the UI, which updates the code in the server and gets reflected back to the UI.
The R Shiny Workflow
User changes input
↓
Shiny stores value in input$...
↓
Server runs the relevant render...() code
↓
UI updates the matching output
Basic Shiny
Refresher on Shiny basics
Input and Output Vocabulary
| Purpose | UI function | What it does | Server pair |
|---|---|---|---|
| Dropdown selection | selectInput() |
Lets the user choose one or more options from a list | input$... |
| Slider | sliderInput() |
Lets the user choose a value or range by dragging | input$... |
| Checkbox | checkboxInput() |
Lets the user turn an option on or off | input$... |
| Numeric entry | numericInput() |
Lets the user type a number | input$... |
| Text entry | textInput() |
Lets the user type text | input$... |
| Date selection | dateInput() / dateRangeInput() |
Lets the user choose a date or period | input$... |
| Plot display | plotOutput() |
Shows a plot created in the server | renderPlot() |
| Text display | textOutput() |
Shows short text | renderText() |
| Printed text | verbatimTextOutput() |
Shows printed or preformatted text | renderPrint() |
| Table display | tableOutput() |
Shows a basic table | renderTable() |
| Interactive table | DTOutput() |
Shows a searchable interactive table | renderDT() |
| HTML content | htmlOutput() |
Shows HTML generated in the server | renderUI() / renderText() |
Panel Layouts (UI)
Publish via shinyapps.io
Intermediate Shiny
# File Name: app.R
# Palmer Penguins Shiny App with Reactive Wikipedia Flashcards

# Set Up ----------------------------------------------------------------------

# Install packages if needed:
# install.packages(c(
#   "shiny",
#   "bslib",
#   "palmerpenguins",
#   "dplyr",
#   "ggplot2",
#   "rvest",
#   "stringr",
#   "tibble"
# ))

library(shiny)
library(bslib)
library(palmerpenguins)
library(dplyr)
library(ggplot2)
library(rvest)
library(stringr)

# Data ------------------------------------------------------------------------

penguins <- palmerpenguins::penguins %>%
  mutate(
    species = as.factor(species),
    island = as.factor(island)
  )

wiki_pages <- c(
  "Adelie" = "https://en.wikipedia.org/wiki/Ad%C3%A9lie_penguin",
  "Chinstrap" = "https://en.wikipedia.org/wiki/Chinstrap_penguin",
  "Gentoo" = "https://en.wikipedia.org/wiki/Gentoo_penguin"
)

# Helper functions ------------------------------------------------------------

filter_penguins <- function(data, species_choice, island_choice) {
  if (species_choice != "All") {
    data <- data %>%
      filter(species == species_choice)
  }

  if (island_choice != "All") {
    data <- data %>%
      filter(island == island_choice)
  }

  data
}

make_absolute_url <- function(src) {
  if (length(src) == 0 || is.na(src[1])) {
    return(NA_character_)
  }

  src <- src[1]

  if (str_starts(src, "//")) {
    src <- paste0("https:", src)
  }

  if (str_starts(src, "/")) {
    src <- paste0("https://en.wikipedia.org", src)
  }

  src
}

get_wikipedia_image <- function(page) {
  img <- page %>%
    html_elements("table.infobox img, table.biota img") %>%
    html_attr("src")

  img <- unique(img[!is.na(img)])

  img <- img[
    !str_detect(
      str_to_lower(img),
      "map|range|distribution|location|svg|icon|commons-logo|wikimedia-logo"
    )
  ]

  if (length(img) == 0) {
    return(NA_character_)
  }

  make_absolute_url(img)
}

scrape_penguin_card <- function(species_name) {
  url <- wiki_pages[[species_name]]

  page <- read_html(url)

  description <- page %>%
    html_elements("p") %>%
    html_text2()

  description <- description[
    nchar(description) > 120 &
      str_detect(description, "[A-Za-z]")
  ]

  if (length(description) == 0) {
    description <- "No suitable description could be extracted from Wikipedia."
  } else {
    description <- description[1]
  }

  tibble::tibble(
    species = species_name,
    source = url,
    image = get_wikipedia_image(page),
    description = description
  )
}

show_penguin_modal <- function(card) {
  showModal(
    modalDialog(
      title = paste(card$species, "penguin"),

      tags$div(
        style = "
          display: flex;
          gap: 1.2rem;
          align-items: flex-start;
        ",

        tags$div(
          style = "
            flex: 0 0 35%;
          ",

          if (!is.na(card$image)) {
            tags$img(
              src = card$image,
              alt = paste(card$species, "penguin"),
              style = "
                width: 100%;
                max-height: 260px;
                object-fit: contain;
                border-radius: 10px;
                background: #f5f5f5;
              "
            )
          } else {
            tags$div(
              style = "
                padding: 1rem;
                background: #f5f5f5;
                border-radius: 10px;
                text-align: center;
              ",
              "No image found."
            )
          }
        ),

        tags$div(
          style = "
            flex: 0 0 65%;
            font-size: 0.95rem;
            line-height: 1.45;
          ",

          tags$p(card$description),

          if (!is.na(card$source)) {
            tags$p(
              tags$a(
                "Source: Wikipedia",
                href = card$source,
                target = "_blank"
              )
            )
          }
        )
      ),

      easyClose = TRUE,
      footer = modalButton("Close"),
      size = "l"
    )
  )
}

# User interface --------------------------------------------------------------

ui <- fluidPage(
  titlePanel("Palmer Penguins with Shiny and Reactive"),

  sidebarLayout(
    sidebarPanel(
      selectInput(
        inputId = "species",
        label = "Choose species",
        choices = c("All", levels(penguins$species)),
        selected = "All"
      ),

      selectInput(
        inputId = "island",
        label = "Choose island",
        choices = c("All", levels(penguins$island)),
        selected = "All"
      ),

      checkboxInput(
        inputId = "show_smooth",
        label = "Show trend line",
        value = TRUE
      ),

      actionButton(
        inputId = "show_card",
        label = "Show species flashcard"
      )
    ),

    mainPanel(
      h3("Summary"),
      verbatimTextOutput("summary_text"),

      h3("Scatterplot"),
      plotOutput("penguin_plot", height = "450px")
    )
  )
)

# Server ----------------------------------------------------------------------

server <- function(input, output, session) {

  # Reactive expression --------------------------------------------------------
  # This is the central filtered dataset.

  filtered_data <- reactive({
    req(input$species)
    req(input$island)

    data <- filter_penguins(
      data = penguins,
      species_choice = input$species,
      island_choice = input$island
    )

    validate(
      need(nrow(data) > 0, "No penguins match the selected filters.")
    )

    data
  })

  # Reactive output ------------------------------------------------------------
  # This output updates automatically when filtered_data() changes.

  output$summary_text <- renderPrint({
    data <- filtered_data()

    cat("Rows:", nrow(data), "\n")
    cat("Species:", paste(unique(data$species), collapse = ", "), "\n")
    cat("Islands:", paste(unique(data$island), collapse = ", "), "\n")
    cat("Average body mass:", round(mean(data$body_mass_g, na.rm = TRUE), 1), "g\n")
  })

  # Reactive output ------------------------------------------------------------
  # This output also uses the same filtered_data() object.

  output$penguin_plot <- renderPlot({
    data <- filtered_data() %>%
      filter(
        !is.na(flipper_length_mm),
        !is.na(body_mass_g)
      )

    validate(
      need(nrow(data) > 0, "No complete observations to plot.")
    )

    p <- ggplot(
      data,
      aes(
        x = flipper_length_mm,
        y = body_mass_g,
        colour = species
      )
    ) +
      geom_point(size = 3, alpha = 0.8) +
      labs(
        x = "Flipper length, mm",
        y = "Body mass, g",
        colour = "Species",
        title = "Body mass and flipper length"
      ) +
      theme_minimal(base_size = 14)

    if (input$show_smooth) {
      p <- p + geom_smooth(method = "lm", se = FALSE)
    }

    p
  })

  # Event-based reactive expression -------------------------------------------
  # It only runs when the user clicks the flashcard button.

  penguin_card <- eventReactive(input$show_card, {
    req(input$species)

    validate(
      need(input$species != "All", "Choose one species before opening a flashcard.")
    )

    tryCatch(
      scrape_penguin_card(input$species),
      error = function(e) {
        tibble::tibble(
          species = input$species,
          source = wiki_pages[[input$species]],
          image = NA_character_,
          description = paste(
            "The Wikipedia flashcard could not be loaded.",
            "Check the internet connection or try again later."
          )
        )
      }
    )
  }, ignoreInit = TRUE)

  # Observer -------------------------------------------------------------------
  # This performs a side effect: it opens a modal window.

  observeEvent(input$show_card, {
    if (input$species == "All") {
      showModal(
        modalDialog(
          title = "Choose one species",
          "Please choose Adelie, Chinstrap, or Gentoo before opening a flashcard.",
          easyClose = TRUE,
          footer = modalButton("Close")
        )
      )
      return()
    }

    card <- penguin_card()
    show_penguin_modal(card)
  }, ignoreInit = TRUE)
}

# Run app ---------------------------------------------------------------------

shinyApp(ui = ui, server = server)App Flowchart
flowchart LR
  A[UI inputs<br/>species, island, trend line] --> B[filtered_data<br/>reactive expression]

  B --> C[summary_text<br/>renderPrint]
  B --> D[penguin_plot<br/>renderPlot]

  E[Show species flashcard<br/>actionButton] --> F[penguin_card<br/>eventReactive]
  A --> F

  F --> G[scrape_penguin_card<br/>Wikipedia text and image]
  G --> H[observeEvent<br/>side effect]
  H --> I[show_penguin_modal<br/>flashcard]

  J[Validation<br/>req, validate, need] --> B
  J --> F
  J --> D
Reactivity
As dashboards grow, simple filters become more fragile
A reactive object stores logic that depends on user inputs.
When the inputs change, Shiny knows which outputs need to update.
Reactive objects must be called with parentheses. E.g.
filtered_penguins()
Reactive Expressions
Example with filter()
Validation
Reactive apps can fail because inputs are missing, filters return no rows, or the data no longer has what an output expects.
req()stops code until required inputs exist.validate()andneed()show a readable message instead of a confusing error.
Events
Not every app should update instantly after every small input change. Sometimes the user should choose filters first and then click a button.
reactive()updates automatically when its inputs change.eventReactive()updates only when a specific event happens.
Observe
observeEvent()is used when something should happen after an event.observeEvent()performs actions and should be placed in the server function.In our penguins app, clicking the flashcard button opens a modal window.
FIRSA Example
Reactive logic in the FIRSA quiz
flowchart LR
  A[Start / Next button] --> B[observeEvent]
  B --> C[Update quiz_step]
  C --> D[renderUI]
  D --> E[Intro, question, result]

  B --> F[Store answer]
  F --> G[quiz_answers]
The app stores a small piece of state:
quiz_step(). When the user clicks Start, Next, Back, or Restart,observeEvent()updates that state. The UI is generated dynamically withrenderUI().
Shiny and Google Cloud Run
What is Google Cloud Run?
Google Cloud Run is a managed service for running containerized (e.g. Docker) applications without having to manage a server.
It handles the infrastructure around the app but lets us define the app, packages, container, memory, CPU, and access settings.
flowchart TD
  A[Shiny app] --> B[Docker container]
  B --> C[Cloud Run service]
  C --> D[Public URL]
  C --> E[Logs and revisions]
  C --> F[Scaling]
Google Cloud Key Elements
Project: the workspace where Google Cloud resources live.
Console: the browser interface for managing Google Cloud.
Cloud Run: the service that runs our Shiny app as a containerized web app.
Cloud Build and Artifact Registry: the services that build and store the container image before Cloud Run runs it.
Deployment Essentials
Checklist:
- a Google Cloud account and a project
- billing enabled for that project
- the Cloud Run API enabled
- the Cloud Build API enabled
- the Artifact Registry API enabled
- an app folder with
app.RandDockerfile
Workflow:
Shiny app files → Dockerfile → Cloud Build → Artifact Registry → Cloud Run service → public URL
What is Docker?
Docker packages an app with everything it needs to run. For Shiny:
- App code,
- R version,
- R packages,
- System libraries,
- Command start up
flowchart TD
  A[Shiny app] --> E[Docker image]
  B[R packages] --> E
  C[System libraries] --> E
  D[Startup command] --> E
  E --> F[Container]
  F --> G[Running dashboard]
A minimal Dockerfile for Shiny
FROM rocker/shiny:4.4.0

USER root

RUN install2.r --error --skipinstalled --ncpus -1 \
    palmerpenguins \
    dplyr \
    ggplot2 \
    DT

WORKDIR /srv/shiny-server

COPY . /srv/shiny-server

RUN chown -R shiny:shiny /srv/shiny-server

ENV PORT=8080
EXPOSE 8080

USER shiny

CMD ["R", "-e", "shiny::runApp('/srv/shiny-server', host='0.0.0.0', port=as.numeric(Sys.getenv('PORT', '8080')))"]
The Dockerfile
FROM rocker/shiny:4.4.0chooses the starting environment, here an image that already contains R and Shiny.RUN install2.r ...installs the R packages the app needs.WORKDIR /srv/shiny-serverandCOPY . /srv/shiny-servercreate the app folder inside the container and copy your local files into it.ENV PORT=8080andEXPOSE 8080sets the port the app will use, should match the service.CMD ["R", "-e", "..."]tells the container what to do when it starts (e.g. run the Shiny app)
Why Shiny on Cloud Run?
Closer to production cloud workflows: Docker logic can be reused for Shiny apps, APIs, Python services, background jobs, or other web apps.
Fine-grained resource control: adjust CPU, memory, concurrency, minimum instances, and maximum instances instead of buying into a fixed publishing platform.
More flexible runtime environment: you can include system libraries, non-R tools, Python, command-line utilities, or unusual package requirements.
Live Demo
Thank you for your attention!
About the FIRSA Project
Disclaimer:
This project has received funding from the European Union Marie Skłodowska-Curie Postdoctoral Fellowships / ERA Fellowships action under grant agreement No. 101180601 under the title: Understanding FinTech Regulatory Sandbox Development in Europe (FIRSA).
Learn more at the project website.

This project has received funding from the European Union Marie Skłodowska-Curie Postdoctoral Fellowships / ERA Fellowships action under grant agreement No. 101180601 under the title: Understanding FinTech Regulatory Sandbox Development in Europe (FIRSA).
Learn more at the project website.
![]()