Example of Zero-Shot Classification for Political Texts
Python
Text Analysis
Google Colab
Tutorial
Data Visualization
Author
Alfredo Hernandez Sanchez
Published
April 21, 2025
Zero-shot classification is a natural language processing (NLP) technique that allows a model to assign labels to text without being explicitly trained on those labels.
Rather than relying on predefined categories from a supervised training dataset, the model uses its understanding of language to infer which label is most appropriate for a given sentence — even if that label has never been seen during training.
Under the hood, the model evaluates how entailment-like the relationship is between the input sentence and each candidate label, and returns a score for each.
Code
# !pip install transformers pandas # if neededfrom transformers import pipelineimport pandas as pdfrom tqdm import tqdmimport randomimport numpy as npimport seaborn as snsimport matplotlib.pyplot as pltimport matplotlib.patches as patches# Set global seedsSEED =42random.seed(SEED)np.random.seed(SEED)tqdm.pandas()
For this analysis, we use a fine-tuned transformer model mlburnhamPolitical_DEBATE_large_v1.0, available via the Hugging Face model hub.
This model is based on a large language model architecture (like BERT or RoBERTa) and has been fine-tuned on political discourse data. Below, we are asking it to classify sentences into the following categories:
Causal claims (“X caused Y”)
Normative claims (“We should do X”)
Factual claims (“X is true”)
Predictive claims (“X will happen”)
Other claims (anything not easily categorized)
Its flexible makes it particularly well-suited for analyzing political speech, news articles, opinion texts, and other sources where text structure matters (as opposed to bag-of-words models).
# Create Example Sentencessentences = ["The government implemented the policy to reduce inflation.","We must do better as a society.","GDP grew by 3.5% this quarter.","It is likely that interest rates will rise.","Who knows what will happen next?","The results could imply a shift, but it depends on interpretation."]
# Function to classify a single sentencedef classify(sentence): result = classifier(sentence, labels) label_scores =dict(zip(result['labels'], result['scores']))return label_scores
Code
# Run classification and convert to DataFramedf = pd.DataFrame({'sentence': sentences})scores_df = df['sentence'].progress_apply(classify).apply(pd.Series)# Merge and rename columnsfinal_df = pd.concat([df, scores_df], axis=1)final_df.columns = ['sentence'] + [label.replace(" ", "_") +"_score"for label in scores_df.columns]# Display resultsfinal_df.head()
100%|██████████| 6/6 [00:57<00:00, 9.51s/it]
sentence
factual_claim_score
causal_claim_score
other_claim_score
predictive_claim_score
normative_claim_score
0
The government implemented the policy to reduc...
0.996155
0.003650
0.000136
0.000038
0.000021
1
We must do better as a society.
0.000005
0.000003
0.000274
0.000003
0.999715
2
GDP grew by 3.5% this quarter.
0.998450
0.000267
0.000657
0.000370
0.000256
3
It is likely that interest rates will rise.
0.001889
0.000005
0.000017
0.998085
0.000004
4
Who knows what will happen next?
0.000012
0.000008
0.000758
0.999213
0.000010
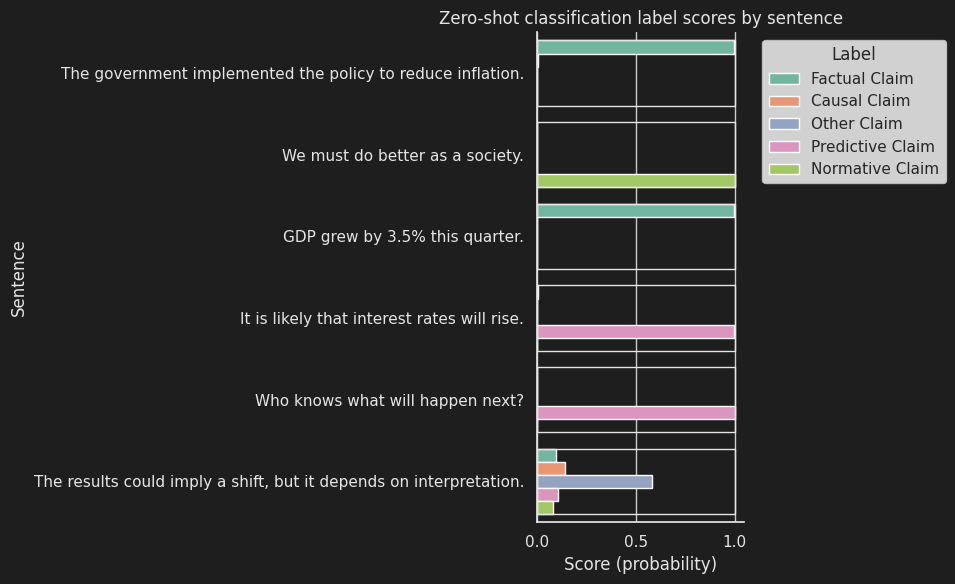
The chart below shows how the model “sees” each sentence. Every sentence is represented by a horizontal bar, and that bar is divided into colored segments — one for each type of claim (like causal, normative, factual, etc.). The size of each segment shows how confident the model is that the sentence fits that type.
If one color dominates the bar, it means the model is pretty sure about that category. If the bar is split more evenly, the sentence might be more ambiguous or could fit into multiple types. This kind of visualization helps us quickly spot patterns in how different kinds of arguments show up in our texts — and whether the model is picking up on them clearly.
Code
# Visualize Datelabel_cols = [col for col in final_df.columns if col.endswith('_score')]long_df = final_df.melt(id_vars=['sentence'], value_vars=label_cols, var_name='label', value_name='score')long_df['label'] = long_df['label'].str.replace('_score', '').str.replace('_', ' ').str.title()plt.style.use("dark_background")plt.figure(figsize=(10, 6))sns.set(style="whitegrid")ax = sns.barplot( data=long_df, x='score', y='sentence', hue='label', palette='Set2', orient='h')ax.set_facecolor("#1e1e1e")ax.figure.set_facecolor("#1e1e1e")ax.tick_params(colors="#e5e5e5")ax.xaxis.label.set_color("#e5e5e5")ax.yaxis.label.set_color("#e5e5e5")ax.title.set_color("#e5e5e5")ax.spines['bottom'].set_color("#e5e5e5")ax.spines['left'].set_color("#e5e5e5")ax.spines['top'].set_visible(False)ax.spines['right'].set_visible(False)legend = ax.get_legend()if legend: frame = legend.get_frame() frame.set_facecolor("#1e1e1e") frame.set_edgecolor("none")for text in legend.get_texts(): text.set_color("#e5e5e5") legend.get_title().set_color("#e5e5e5")for i, sentence inenumerate(final_df['sentence']): bar_height =0.8# Adjust if needed ax.add_patch( patches.Rectangle( (0, i - bar_height /2), # (x, y)1.0, # width bar_height, # height fill=False, edgecolor='#e5e5e5', linewidth=1 ) )plt.xlabel("Score (probability)")plt.ylabel("Sentence")plt.title("Zero-shot classification label scores by sentence")plt.legend(title='Label', bbox_to_anchor=(1.05, 1), loc='upper left')plt.tight_layout()plt.show()
This approach makes it possible to analyze the argumentative structure of text at scale, without needing labeled data, offering a powerful tool for research in political discourse, media studies, and beyond.